DOW, S&P500, NASDAQ - 5 Year Review (2006 - 2010)
NASDAQ: The NASDAQ was the index with the best performance during the 2006-2010 period with an overall increase of 14.2%. NASDAQ's best year was 2009 with +45.1% which was a complete reversal of the previous (and its only losing year) when it recorded a yearly performance of -40.5%. Amongst the 3 indices examined it was the only one that completely recouped the losses of 2008 during 2009. The NASDAQ was the index with the highest yearly performance in 2009 and 2010, the least profitable performance in 2006 and the worst performance of 2008.
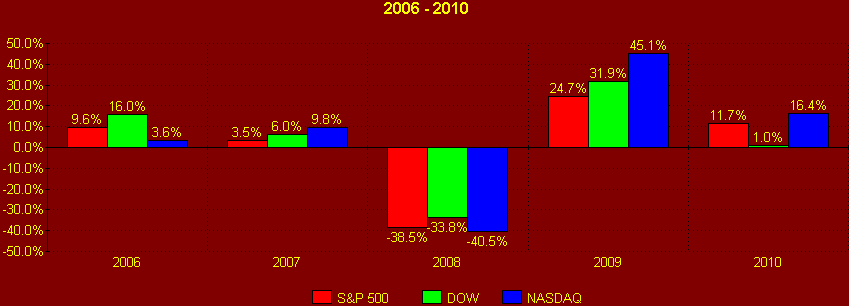
DOW: The Dow was in second place with an overall increase of 8.5%. Its best year was 2009 (+31.9%) and its worst 2008 (-33.8%). The DOW was the best performer of 2006 and the index with the least profitable year in 2010.
S&P 500: The S&P500 was the only loser of the three indices for the past 5 years with an overall performance of -2.8%. Its best year was 2009 (+24.7%) and its worst 2008 (-38.5%). It was the least profitable index for 2007.
Disclaimer: WorldFinancialMarkets and MarchesMondiaux do not guarantee the accuracy of data and analysis presented in the site/upload & download time/site access & reliability. Furthermore, this site is not recommending, promoting or advising on investments and investment strategies. Data contained in this site are subject to copyright and are not to be reproduced in any form without the explicit written agreement of the publishers.
NASDAQ: The NASDAQ was the index with the best performance during the 2006-2010 period with an overall increase of 14.2%. NASDAQ's best year was 2009 with +45.1% which was a complete reversal of the previous (and its only losing year) when it recorded a yearly performance of -40.5%. Amongst the 3 indices examined it was the only one that completely recouped the losses of 2008 during 2009. The NASDAQ was the index with the highest yearly performance in 2009 and 2010, the least profitable performance in 2006 and the worst performance of 2008.
DOW: The Dow was in second place with an overall increase of 8.5%. Its best year was 2009 (+31.9%) and its worst 2008 (-33.8%). The DOW was the best performer of 2006 and the index with the least profitable year in 2010.
S&P 500: The S&P500 was the only loser of the three indices for the past 5 years with an overall performance of -2.8%. Its best year was 2009 (+24.7%) and its worst 2008 (-38.5%). It was the least profitable index for 2007.
| End 2005 | End 2006 | End 2007 | End 2008 | End 2009 | End 2010 | 2006 - 2010 Average | 2006 - 2010 Actual | |
|---|---|---|---|---|---|---|---|---|
| S&P 500 | 1,294 | 1,418 | 1,468 | 903 | 1,126 | 1,258 | -7 | -36 |
| 9.6% | 3.5% | -38.5% | 24.7% | 11.7% | -0.6% | -2.8% | ||
| DOW | 10,785 | 12,511 | 13,265 | 8,776 | 11,578 | 11,697 | 182 | 912 |
| 16.0% | 6.0% | -33.8% | 31.9% | 1.0% | 1.7% | 8.5% | ||
| NASDAQ | 2,331 | 2,415 | 2,652 | 1,577 | 2,288 | 2,663 | 66 | 332 |
| 3.6% | 9.8% | -40.5% | 45.1% | 16.4% | 2.8% | 14.2% |
Last Updated 2 January, 2011
Disclaimer: WorldFinancialMarkets and MarchesMondiaux do not guarantee the accuracy of data and analysis presented in the site/upload & download time/site access & reliability. Furthermore, this site is not recommending, promoting or advising on investments and investment strategies. Data contained in this site are subject to copyright and are not to be reproduced in any form without the explicit written agreement of the publishers.