Major Indices- 5 Year Review (2006 - 2010)
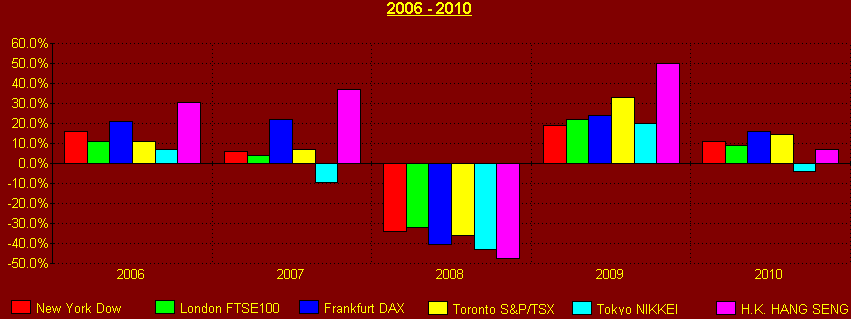
5 year Best Performing Index: The Hong Kong HANG SENG was the best performing index for the past 5 years, with an increase 50.1% (on average +15.3% per year). It gained 7,691 points (on average +1,538 points per year) and had 4 out of the 5 years profitable. It was the best performing index for 2006 (+30.4%), 2007 (+36.8%) and 2009 (+50.0%), although during its only losing year (2008) it was the worst performing index (-47.7%). It is worth pointing out that in 2010, although profitable, its percentage rate of increase was 7.2% a long way away from the 30%-50% increases of 2006, 2007 and 2009. It is also worth mentioning that in 2009 it was the only index that recouped and gained ground on the previous year's losses.
5 year Worst Performing Index: Tokyo's NIKKEI was the worst performing index of the past 5 years (and the only one of the 6 indices to have a negative performance for the 2006-2010 period), with a fall of 36.36% (on average -5.9% per year). It lost 5,895 points (on average -1,179 per year) and had 3 out of the 5 years in the red. Its worst year was 2008 (-43.1%) and its best 2009 (+20.0%). It is also worth mentioning that it was the index with the lowest positive performance in 2006 (+6.8%), the worst (and only losing index) in 2007 (-9.6%), the second worst performing index of 2008 (-43.1%), the index with the second lowest positive performance in 2009 (+20.0%) and the worst performing index of 2010 (-3.8%).
Disclaimer: WorldFinancialMarkets and MarchesMondiaux do not guarantee the accuracy of data and analysis presented in the site/upload & download time/site access & reliability. Furthermore, this site is not recommending, promoting or advising on investments and investment strategies. Data contained in this site are subject to copyright and are not to be reproduced in any form without the explicit written agreement of the publishers.
5 year Best Performing Index: The Hong Kong HANG SENG was the best performing index for the past 5 years, with an increase 50.1% (on average +15.3% per year). It gained 7,691 points (on average +1,538 points per year) and had 4 out of the 5 years profitable. It was the best performing index for 2006 (+30.4%), 2007 (+36.8%) and 2009 (+50.0%), although during its only losing year (2008) it was the worst performing index (-47.7%). It is worth pointing out that in 2010, although profitable, its percentage rate of increase was 7.2% a long way away from the 30%-50% increases of 2006, 2007 and 2009. It is also worth mentioning that in 2009 it was the only index that recouped and gained ground on the previous year's losses.
5 year Worst Performing Index: Tokyo's NIKKEI was the worst performing index of the past 5 years (and the only one of the 6 indices to have a negative performance for the 2006-2010 period), with a fall of 36.36% (on average -5.9% per year). It lost 5,895 points (on average -1,179 per year) and had 3 out of the 5 years in the red. Its worst year was 2008 (-43.1%) and its best 2009 (+20.0%). It is also worth mentioning that it was the index with the lowest positive performance in 2006 (+6.8%), the worst (and only losing index) in 2007 (-9.6%), the second worst performing index of 2008 (-43.1%), the index with the second lowest positive performance in 2009 (+20.0%) and the worst performing index of 2010 (-3.8%).
| End 2005 | End 2006 | End 2007 | End 2008 | End 2009 | End 2010 | 2006-2010 Average | 2006-2010 Actual | |
|---|---|---|---|---|---|---|---|---|
| New York Dow | 10,785 | 12,511 | 13,265 | 8,776 | 10,428 | 11,578 | 159 | 793 |
| 16.0% | 6.0% | -33.8% | 18.8% | 11.0% | 1.5% | 7.4% | ||
| London FTSE100 | 5,619 | 6,245 | 6,498 | 4,434 | 5,413 | 5,900 | 56 | 281 |
| 11.1% | 4.0% | -31.8% | 22.1% | 9.0% | 1.0% | 5.0% | ||
| Frankfurt DAX | 5,459 | 6,612 | 8,067 | 4,810 | 5,957 | 6,914 | 291 | 1,456 |
| 21.1% | 22.0% | -40.4% | 23.8% | 16.1% | 5.3% | 26.7% | ||
| Toronto S&P/TSX | 11,620 | 12,910 | 13,821 | 8,831 | 11,746 | 13,443 | 365 | 1,823 |
| 11.1% | 7.1% | -36.1% | 33.0% | 14.4% | 3.1% | 15.7% | ||
| Tokyo NIKKEI | 16,124 | 17,226 | 15,565 | 8,860 | 10,634 | 10,229 | -1,179 | -5,895 |
| 6.8% | -9.6% | -43.1% | 20.0% | -3.8% | -7.3% | -36.6% | ||
| Hong Kong HANG SENG | 15,344 | 20,002 | 27,371 | 14,328 | 21,497 | 23,035 | 1,538 | 7,691 |
| 30.4% | 36.8% | -47.7% | 50.0% | 7.2% | 10.0% | 50.1% |
Last Updated 2 January, 2011
Disclaimer: WorldFinancialMarkets and MarchesMondiaux do not guarantee the accuracy of data and analysis presented in the site/upload & download time/site access & reliability. Furthermore, this site is not recommending, promoting or advising on investments and investment strategies. Data contained in this site are subject to copyright and are not to be reproduced in any form without the explicit written agreement of the publishers.