Foreign Exchange EUR, USD, GBP - 5 Year Review (2006 - 2010)
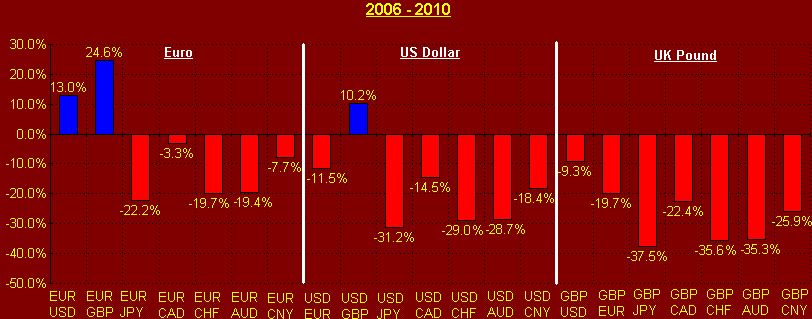
Euro: The Euro was a relative winner during the past five years, given its performance against US Dollar and the UK Pound. Its highest increase was versus the Sterling (+24.6%) and the second highest (and only additional) increase versus the US Dollar (+13.0%). Its biggest drop was against the Japanese Yen (-22.2%). Euro's best yearly performance was against the UK pound in 2008 (+32.0%) and its worst was versus the Japanese Yen in 2008 (-23.0%). Its worth pointing out that the Euro has been falling against the Swiss Franc for the past three years (2008, 2009, 2010, in total -24.6%). This is also the longest running negative period for the Euro. Euro's longest positive run was against the Australian Dollar during the period 2006-2008. Finally, it should be mentioned that the Euro fell against all other major currencies in 2010.
US Dollar: The US Dollar fell against all majors with the exception of Sterling during the 2006-2010 period. Its highest (and sole) increase was indeed against the UK Pound (+10.2%). Its biggest drop was against the Japanese Yen (-31.2%). Its best yearly performance was against the UK Pound in 2008 (+38.0%) and its worst against the Australian Dollar in 2009 (-22.7%). It is worth pointing out that the US Dollars has been falling for 5 consecutive years (2006-2010) against the Swiss Franc (in total -29.0%) and also against the Chinese Yuan (in total -18.4%). In addition, the US Dollar fell against all other currencies during 2007. Finally, it is worth mentioning that the US had not had any two consecutive yearly rises against any currency during these past 5 years.
British Pound: The UK Pound was the undisputed loser amongst the three major currencies examined, during the last 5 years. It fell against all other major currencies and its biggest fall was against the Japanese Yen (-37.5%). Its best yearly performance was against the Japanese Yen in 2006 (+15.0%). Its worst yearly performance was against the Japanese Yen in 2008 (-41.7%). It should be mentioned that Sterling was profitable against all major currencies in 2006, but had four consecutive losing years (2007-2010) against the Canadian Dollar and the Australian Dollar.
Disclaimer: WorldFinancialMarkets and MarchesMondiaux do not guarantee the accuracy of data and analysis presented in the site/upload & download time/site access & reliability. Furthermore, this site is not recommending, promoting or advising on investments and investment strategies. Data contained in this site are subject to copyright and are not to be reproduced in any form without the explicit written agreement of the publishers.
Euro: The Euro was a relative winner during the past five years, given its performance against US Dollar and the UK Pound. Its highest increase was versus the Sterling (+24.6%) and the second highest (and only additional) increase versus the US Dollar (+13.0%). Its biggest drop was against the Japanese Yen (-22.2%). Euro's best yearly performance was against the UK pound in 2008 (+32.0%) and its worst was versus the Japanese Yen in 2008 (-23.0%). Its worth pointing out that the Euro has been falling against the Swiss Franc for the past three years (2008, 2009, 2010, in total -24.6%). This is also the longest running negative period for the Euro. Euro's longest positive run was against the Australian Dollar during the period 2006-2008. Finally, it should be mentioned that the Euro fell against all other major currencies in 2010.
US Dollar: The US Dollar fell against all majors with the exception of Sterling during the 2006-2010 period. Its highest (and sole) increase was indeed against the UK Pound (+10.2%). Its biggest drop was against the Japanese Yen (-31.2%). Its best yearly performance was against the UK Pound in 2008 (+38.0%) and its worst against the Australian Dollar in 2009 (-22.7%). It is worth pointing out that the US Dollars has been falling for 5 consecutive years (2006-2010) against the Swiss Franc (in total -29.0%) and also against the Chinese Yuan (in total -18.4%). In addition, the US Dollar fell against all other currencies during 2007. Finally, it is worth mentioning that the US had not had any two consecutive yearly rises against any currency during these past 5 years.
British Pound: The UK Pound was the undisputed loser amongst the three major currencies examined, during the last 5 years. It fell against all other major currencies and its biggest fall was against the Japanese Yen (-37.5%). Its best yearly performance was against the Japanese Yen in 2006 (+15.0%). Its worst yearly performance was against the Japanese Yen in 2008 (-41.7%). It should be mentioned that Sterling was profitable against all major currencies in 2006, but had four consecutive losing years (2007-2010) against the Canadian Dollar and the Australian Dollar.
| End 2005 | End 2006 | End 2007 | End 2008 | End 2009 | End 2010 | 2006-2010 Average | 2006-2010 Actual | |
|---|---|---|---|---|---|---|---|---|
| EUR/USD | 1.1845 | 1.3203 | 1.4728 | 1.4097 | 1.4333 | 1.3391 | 31 | 155 |
| 11.5% | 11.6% | -4.3% | 1.7% | -6.6% | 2.6% | 13.0% | ||
| EUR/GBP | 0.6884 | 0.6743 | 0.7379 | 0.9740 | 0.9000 | 0.8577 | 34 | 169 |
| -2.0% | 9.4% | 32.0% | -7.6% | -4.7% | 4.9% | 24.6% | ||
| EUR/JPY | 139.5930 | 157.1990 | 165.4160 | 127.4190 | 132.2130 | 108.6630 | -62 | -309 |
| 12.6% | 5.2% | -23.0% | 3.8% | -17.8% | -4.4% | -22.2% | ||
| EUR/CAD | 1.3811 | 1.5399 | 1.4464 | 1.7238 | 1.5041 | 1.3356 | -9 | -46 |
| 11.5% | -6.1% | 19.2% | -12.7% | -11.2% | -0.6% | -3.3% | ||
| EUR/CHF | 1.5585 | 1.6097 | 1.6587 | 1.4888 | 1.4877 | 1.2513 | -61 | -307 |
| 3.3% | 3.0% | -10.2% | -0.1% | -15.9% | -3.9% | -19.7% | ||
| EUR/AUD | 1.6232 | 1.6747 | 1.6818 | 2.0423 | 1.6052 | 1.3087 | -63 | -315 |
| 3.2% | 0.4% | 21.4% | -21.4% | -18.5% | -3.9% | -19.4% | ||
| EUR/CNY | 9.5625 | 10.3212 | 10.7726 | 9.6626 | 9.8000 | 8.8257 | -147 | -737 |
| 7.9% | 4.4% | -10.3% | 1.4% | -9.9% | -1.5% | -7.7% |
| End 2005 | End 2006 | End 2007 | End 2008 | End 2009 | End 2010 | 2006-2010 Average | 2006-2010 Actual | |
|---|---|---|---|---|---|---|---|---|
| USD/EUR | 0.8442 | 0.7574 | 0.6790 | 0.7094 | 0.6977 | 0.7468 | -19 | -97 |
| -10.3% | -10.4% | 4.5% | -1.6% | 7.0% | -2.3% | -11.5% | ||
| USD/GBP | 0.5813 | 0.5107 | 0.5009 | 0.6910 | 0.6278 | 0.6406 | 12 | 59 |
| -12.1% | -1.9% | 38.0% | -9.1% | 2.0% | 2.0% | 10.2% | ||
| USD/JPY | 117.8680 | 119.1110 | 112.3500 | 90.3843 | 92.2401 | 81.1500 | -73 | -367 |
| 1.1% | -5.7% | -19.6% | 2.1% | -12.0% | -6.2% | -31.2% | ||
| USD/CAD | 1.1660 | 1.1664 | 0.9820 | 1.2228 | 1.0494 | 0.9974 | -34 | -169 |
| 0.0% | -15.8% | 24.5% | -14.2% | -5.0% | -2.9% | -14.5% | ||
| USD/CHF | 1.3159 | 1.2197 | 1.1267 | 1.0561 | 1.0380 | 0.9345 | -76 | -381 |
| -7.3% | -7.6% | -6.3% | -1.7% | -10.0% | -5.8% | -29.0% | ||
| USD/AUD | 1.3703 | 1.2685 | 1.1419 | 1.4487 | 1.1199 | 0.9773 | -79 | -393 |
| -7.4% | -10.0% | 26.9% | -22.7% | -12.7% | -5.7% | -28.7% | ||
| USD/CNY | 8.0734 | 7.8175 | 7.3141 | 6.8542 | 6.8372 | 6.5910 | -296 | -1,482 |
| -3.2% | -6.4% | -6.3% | -0.2% | -3.6% | -3.7% | -18.4% |
| End 2005 | End 2006 | End 2007 | End 2008 | End 2009 | End 2010 | 2006-2010 Average | 2006-2010 Actual | |
|---|---|---|---|---|---|---|---|---|
| GBP/USD | 1.7203 | 1.9581 | 1.9964 | 1.4472 | 1.5928 | 1.5612 | -32 | -159 |
| 13.8% | 2.0% | -27.5% | 10.1% | -2.0% | -1.8% | -9.3% | ||
| GBP/EUR | 1.4526 | 1.4830 | 1.3552 | 1.0267 | 1.1111 | 1.1659 | -57 | -287 |
| 2.1% | -8.6% | -24.2% | 8.2% | 4.9% | -3.9% | -19.7% | ||
| GBP/JPY | 202.8160 | 233.3030 | 224.3120 | 130.8570 | 146.9220 | 126.6870 | -152 | -761 |
| 15.0% | -3.9% | -41.7% | 12.3% | -13.8% | -7.5% | -37.5% | ||
| GBP/CAD | 2.0065 | 2.2851 | 1.9614 | 1.7704 | 1.6715 | 1.5571 | -90 | -449 |
| 13.9% | -14.2% | -9.7% | -5.6% | -6.8% | -4.4% | -22.4% | ||
| GBP/CHF | 2.2643 | 2.3890 | 2.2498 | 1.5286 | 1.6533 | 1.4589 | -161 | -805 |
| 5.5% | -5.8% | -32.1% | 8.2% | -11.8% | -7.1% | -35.6% | ||
| GBP/AUD | 2.3579 | 2.4851 | 2.2807 | 2.0976 | 1.7838 | 1.5258 | -166 | -832 |
| 5.4% | -8.2% | -8.0% | -15.0% | -14.5% | -7.0% | -35.3% | ||
| GBP/CNY | 13.8926 | 15.3155 | 14.6085 | 9.9243 | 10.8903 | 10.2895 | -721 | -3,603 |
| 10.2% | -4.6% | -32.1% | 9.7% | -5.5% | -5.1% | -25.9% |
Last Updated 2 January, 2011
Disclaimer: WorldFinancialMarkets and MarchesMondiaux do not guarantee the accuracy of data and analysis presented in the site/upload & download time/site access & reliability. Furthermore, this site is not recommending, promoting or advising on investments and investment strategies. Data contained in this site are subject to copyright and are not to be reproduced in any form without the explicit written agreement of the publishers.