World Equity Indices
| Week's Best |
Week's Worst |
Biggest One-Day Rise |
Biggest One-Day Fall |
| Athens GD |
+6.27% |
Shanghai SHCOMP |
-2.72% |
Athens GD |
+4.46% |
Shanghai SHCOMP |
-3.03% |
|
| Month's Best |
|
Month's Worst |
|
Biggest One-Day Rise |
Biggest One-Day Fall |
| Madrid IGBM |
+10.24% |
Shanghai SHCOMP |
-3.30% |
Madrid IGBM |
+5.61% |
Shanghai SHCOMP |
-3.03% |
|
| Year's Best |
|
Year's Worst |
|
Biggest One-Day Rise |
Biggest One-Day Fall |
| Madrid IGBM |
+10.24% |
Shanghai SHCOMP |
-3.30% |
Madrid IGBM |
+5.61% |
Shanghai SHCOMP |
-3.03% |
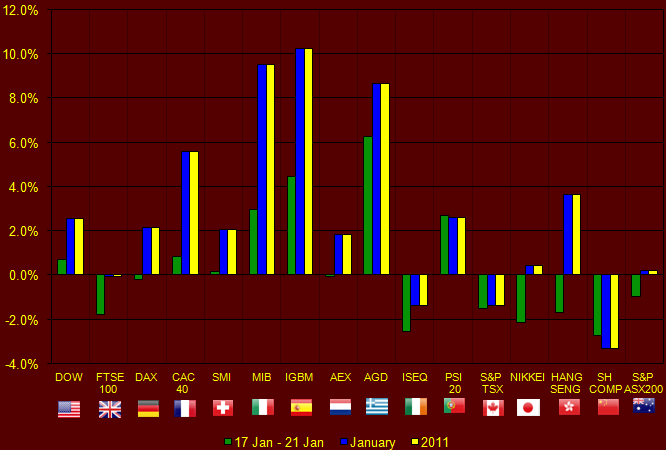
Additional Points of Analysis
- The majority of indices finished the week in the red (the exact opposite of last week)
- The Shanghai SHCOMP was the worst index for the second consecutive week
- The Athens GD was the best daily performer on 3 separate occasions during the week
- The Athens GD recorded a new biggest one-day rise +4.46% on Wed. 19 Jan
- The Shanghai SHCOMP recorded a new biggest one-day loss -3.03% on Mon. 17 Jan
- The Lisbon PSI20 and the Milan MIB both ended the week with 4 consecutive profitable trading days.
- Madrid’s IGBM moved to first place on the monthly/yearly performance
- Shanghai’s SHCOMP continued for the second consecutive week to be the worst monthly/yearly performer
- 4 indices are currently in the red for the month/year (in Jan 2010 almost all indices were in the red)
- 4 indices have an over 5% monthly/yearly increase (Madrid IGBM, Milan MIB, Athens GD and Paris CAC40)
| Index | 17 Jan - 21 Jan | January | 2011 | 14 January 2011 | 21 January 2011 | December | January |
|---|
| New York DOW | 0.7% | 2.5% | 2.5% | 11,787 | 11,872 | 11,578 | 11,872 | | London FTSE100 | -1.8% | -0.1% | -0.1% | 6,002 | 5,896 | 5,900 | 5,896 | | Frankfurt DAX | -0.2% | 2.1% | 2.1% | 7,076 | 7,062 | 6,914 | 7,062 | | Paris CAC40 | 0.9% | 5.6% | 5.6% | 3,983 | 4,017 | 3,805 | 4,017 | | Zurich SMI | 0.2% | 2.0% | 2.0% | 6,556 | 6,567 | 6,436 | 6,567 | | Milan MIB | 3.0% | 9.5% | 9.5% | 21,460 | 22,094 | 20,173 | 22,094 | | Madrid IGBM | 4.4% | 10.2% | 10.2% | 1,059 | 1,107 | 1,004 | 1,107 | | Amsterdam AEX | -0.1% | 1.8% | 1.8% | 361 | 361 | 355 | 361 | | Athens GD | 6.3% | 8.7% | 8.7% | 1,446 | 1,537 | 1,414 | 1,537 | | Dublin ISEQ | -2.5% | -1.4% | -1.4% | 2,920 | 2,846 | 2,885 | 2,846 | | Lisbon PSI20 | 2.7% | 2.6% | 2.6% | 7,581 | 7,787 | 7,588 | 7,787 | | Toronto S&P/TSX | -1.5% | -1.4% | -1.4% | 13,464 | 13,259 | 13,443 | 13,259 | | Tokyo NIKKEI | -2.1% | 0.4% | 0.4% | 10,499 | 10,275 | 10,229 | 10,275 | | Hong Kong HANG SENG | -1.7% | 3.7% | 3.7% | 24,283 | 23,877 | 23,035 | 23,877 | | Shanghai SHCOMP | -2.7% | -3.3% | -3.3% | 2,791 | 2,715 | 2,808 | 2,715 | | Sydney S&P/ASX200 | -1.0% | 0.2% | 0.2% | 4,802 | 4,756 | 4,745 | 4,756 |
Disclaimer:
WorldFinancialMarkets and MarchesMondiaux do not guarantee the accuracy
of data and analysis presented in the site/upload & download
time/site access & reliability. Furthermore, this site is not
recommending, promoting or advising on investments and investment
strategies. Data contained in this site are subject to copyright and are
not to be reproduced in any form without the explicit written agreement
of the publishers.
| Change Language

2010 Review
5 Year Review (2006-2010)
Special Reports
On Twitter (ID: MarketsUpdate)
Updated each Saturday at 07:00 GMT
|